How Much Power Does an AI Data Center Need? Real MW Ranges for 2026
From AI rack density to cooling overhead and phased campus demand, see how data center power requirements add up in megawatts using 2026 data and a worked example.
Every AI data center project starts with the same question: How many megawatts will this site need? The answer is built from the rack up, and in 2026 the rack itself has changed. Here is how the math works, what the current data says, and what the numbers mean for anyone trying to bring a facility online on schedule.
It Starts at the Rack
Across most of the industry, server racks still draw modest amounts of power. Uptime Institute’s 2025 Global Data Center Survey found the average typical rack density was just under 9 kW, and more than 80% of operators reported no racks above 30 kW at all.
AI hardware breaks that pattern. A current-generation NVIDIA Vera Rubin NVL72 rack, as specified by server manufacturer GIGABYTE, draws up to 240 kW. That is more than 25 times the industry’s typical rack, in roughly the same footprint. The International Energy Agency (IEA) reports that AI server power density increased 11 times between 2020 and 2025 and is set to rise another fourfold by 2027, when a single advanced rack could carry the peak demand of 65 households.
From Rack to Meter: The Math
Racks are only the IT load. Your utility connection, or on-site generation, also has to carry cooling, power-conversion losses, and everything else in the building. The industry measures that overhead with power usage effectiveness (PUE): total facility power divided by IT power.
Uptime’s 2025 survey put the weighted average PUE at 1.54. Facilities of 20 MW and larger did better, averaging 1.44.
Put those together with a simple example. A hall of 500 AI racks at 200 kW each is 100 MW of IT load. At a PUE of 1.44, the facility needs roughly 144 MW. At the industry average of 1.54, it needs about 154 MW. That 10 MW difference comes entirely from how the building handles heat and power conversion. These figures are illustrative; actual requirements depend on hardware, cooling design, climate, and redundancy.
Averages also hide something important. According to the IEA, AI data centers see server load swings of more than 50% of rated capacity within a single second. Power infrastructure has to be sized for those peaks and fast transitions, not just the monthly average.
Real MW Ranges, From First Hall to Full Campus
With per-rack and overhead numbers in hand, the published reference points fall into place.
Under 50 MW. Florida’s new data center law, Chapter 2026-65 (SB 484), sets the threshold for a “large load customer” at an anticipated monthly peak of 50 MW or more at a single location. Below that line sit enterprise AI rooms, inference sites, and the first phases of larger campuses.
50 MW and up. Once a Florida project crosses that threshold, utility tariffs must ensure the customer bears its own full cost of service, and the Florida Public Service Commission sets minimum tariff and service requirements.
A typical AI-focused facility. The IEA’s 2025 Energy and AI report estimates that a typical AI-focused data center consumes as much electricity as 100,000 households.
The largest campuses. The same report finds the largest AI data centers under construction will consume 20 times as much as that typical facility.
Utility scale. Florida Power & Light’s 2026–2035 Ten-Year Site Plan assumes demand from large load customers begins materializing in 2028 and reaches 3 GW of peak demand by 2035.
Why the Grid Is Feeling It
Multiply those facilities across the country and the national numbers move fast. Lawrence Berkeley National Laboratory found U.S. data centers used 176 TWh of electricity in 2023, about 4.4% of the national total, and projected 325 to 580 TWh by 2028, or roughly 6.7% to 12%.
Globally, the IEA’s April 2026 update reports that data center electricity demand grew 17% in 2025, while consumption at AI-focused data centers jumped 50%. The agency projects total data center use roughly doubling, from 485 TWh in 2025 to about 950 TWh in 2030.
Grid planners see the same curve. The North American Electric Reliability Corporation (NERC) forecasts summer peak demand rising by more than 224 GW over the next decade, 69% higher than its prior projection, with new AI and digital-economy data centers accounting for most of the increase. NERC also notes that its data center forecasts are likely more conservative than projections from the technology industry.
What This Means for Your Site
For a developer, the national total matters less than timing. The IEA notes that data centers are filled with operating servers progressively, so your power need climbs in steps as each hall comes online. It also reports that U.S. developers, constrained by slow grid connections, are turning to on-site generation.
The practical result: power is now on the critical path. Sizing for peak load, phasing capacity to match rack deployment, and securing supply that arrives when the racks do all have to happen at the start of a project, not after the building is framed.
Where the Flying Pig™ Fits
VIVIFY is engineering the Flying Pig™ for stepped demand like this. Each containerized unit will deliver up to 1MW of behind-the-meter hydrogen power, with water as the primary input. Units couple through a quick-connect system, so capacity will scale by adding containers, and field assembly will be measured in hours, not weeks.
That lets you add dedicated power as each hall fills, rather than holding a finished building for a full-campus interconnection. For loads that call for a permanent, site-scale plant, the HOG™ platform will scale from a single site to a full district. Both are being designed to work alongside the host utility, adding capacity where demand is most concentrated.
Schedule a Capability Review
Contact us with your rack plan, load profile, and deployment timeline. The VIVIFY engineering team will map Flying Pig™ and HOG™ capacity to your site, phase by phase.
Not ready for that conversation yet? Follow VIVIFY on LinkedIn and Instagram for deployment updates and engineering news from the Delray Beach lab.
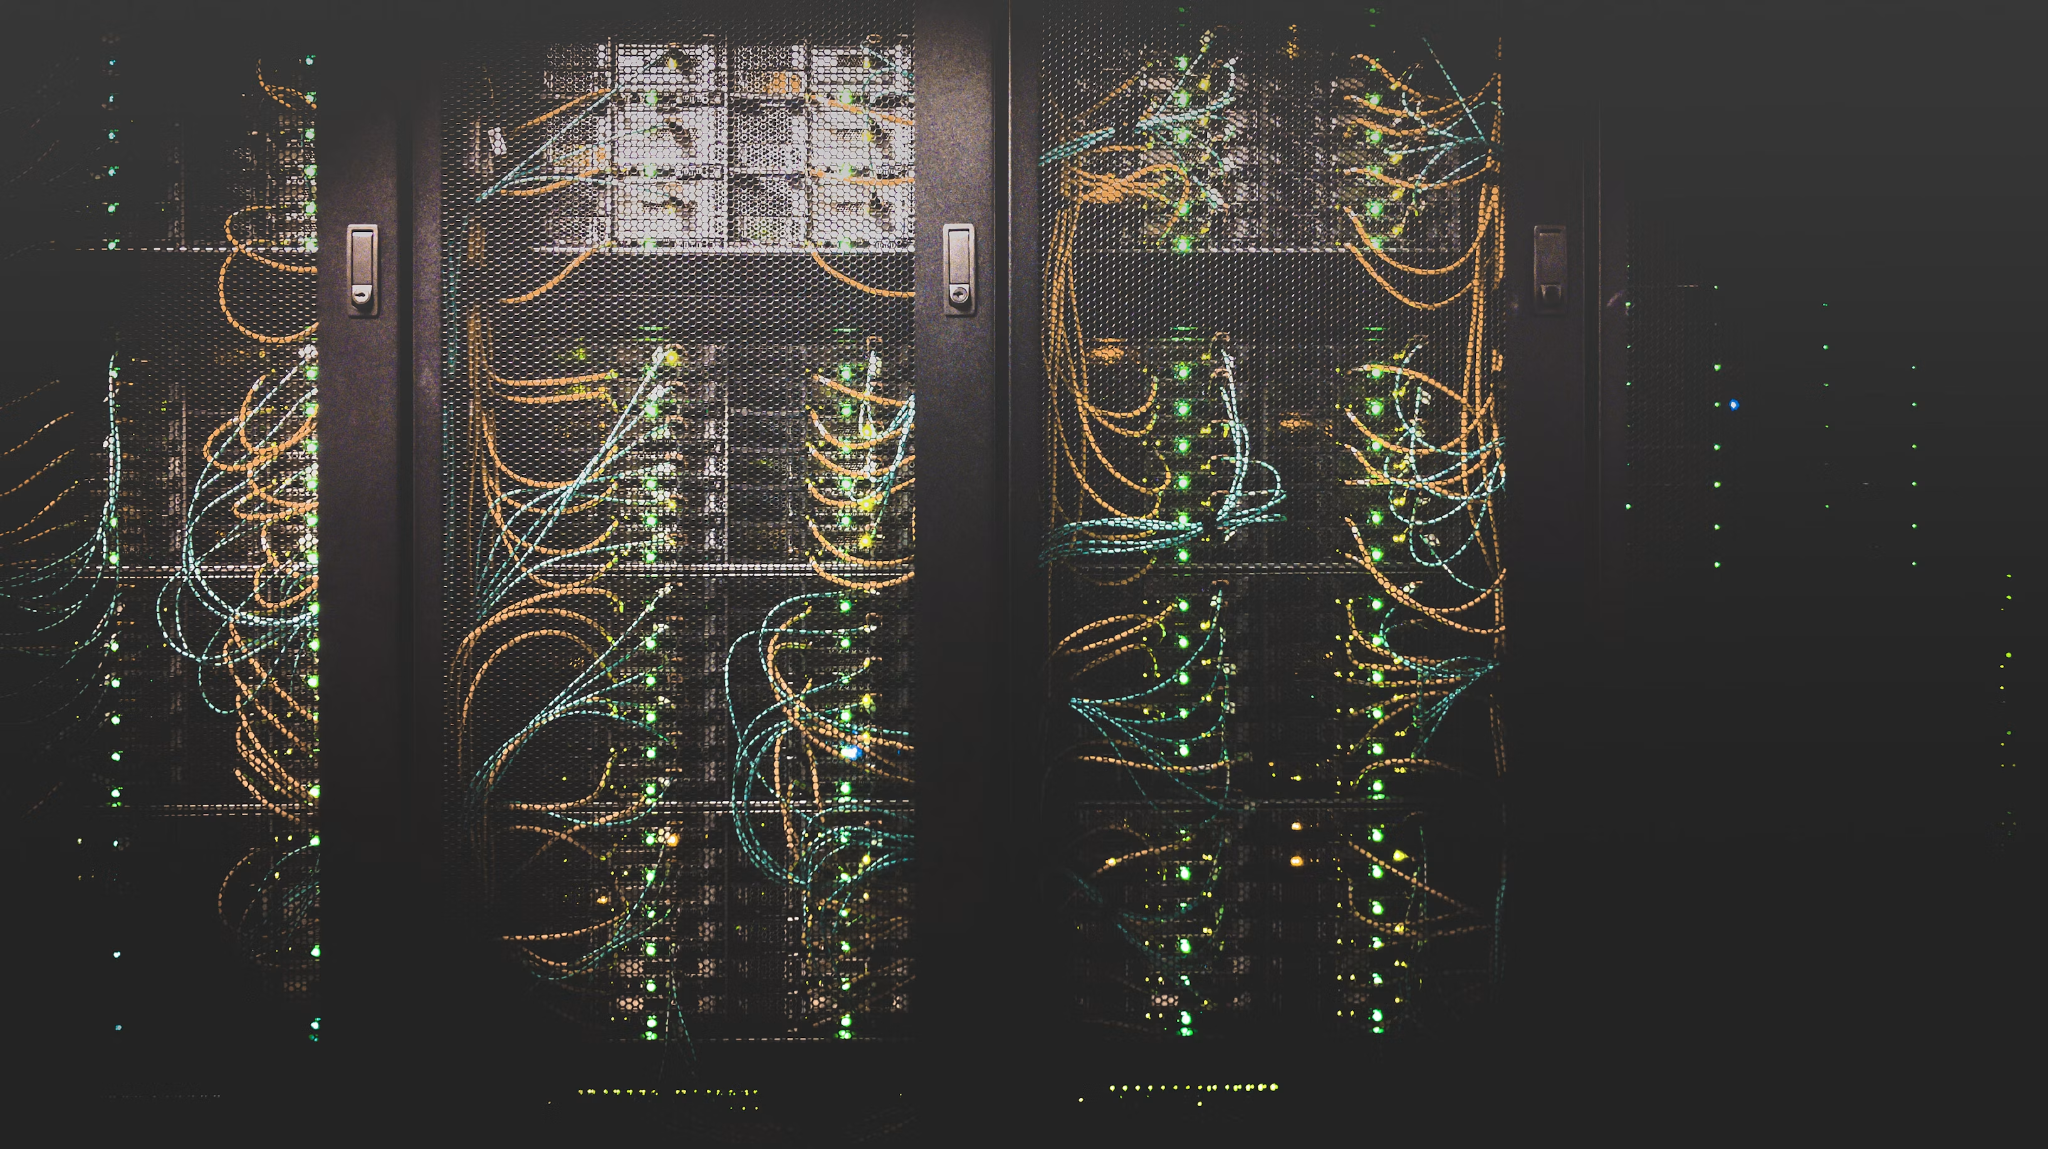
Featured image: Photo by Taylor Vick on Unsplash.
