
192 TWh
electricity consumed by U.S. data centers in 2024 — about 4.7% of total U.S. electricity use, and more than double the 1.9% share recorded in 2018.
Source: Lawrence Berkeley National Laboratory, 2025 Data Center Energy Usage Report Update
Application 02 — Data Center Power
Utility interconnection queues stretch years. Grid congestion in high-demand corridors is structural. The AI and data center boom is real, and the power infrastructure to support it is not keeping pace.
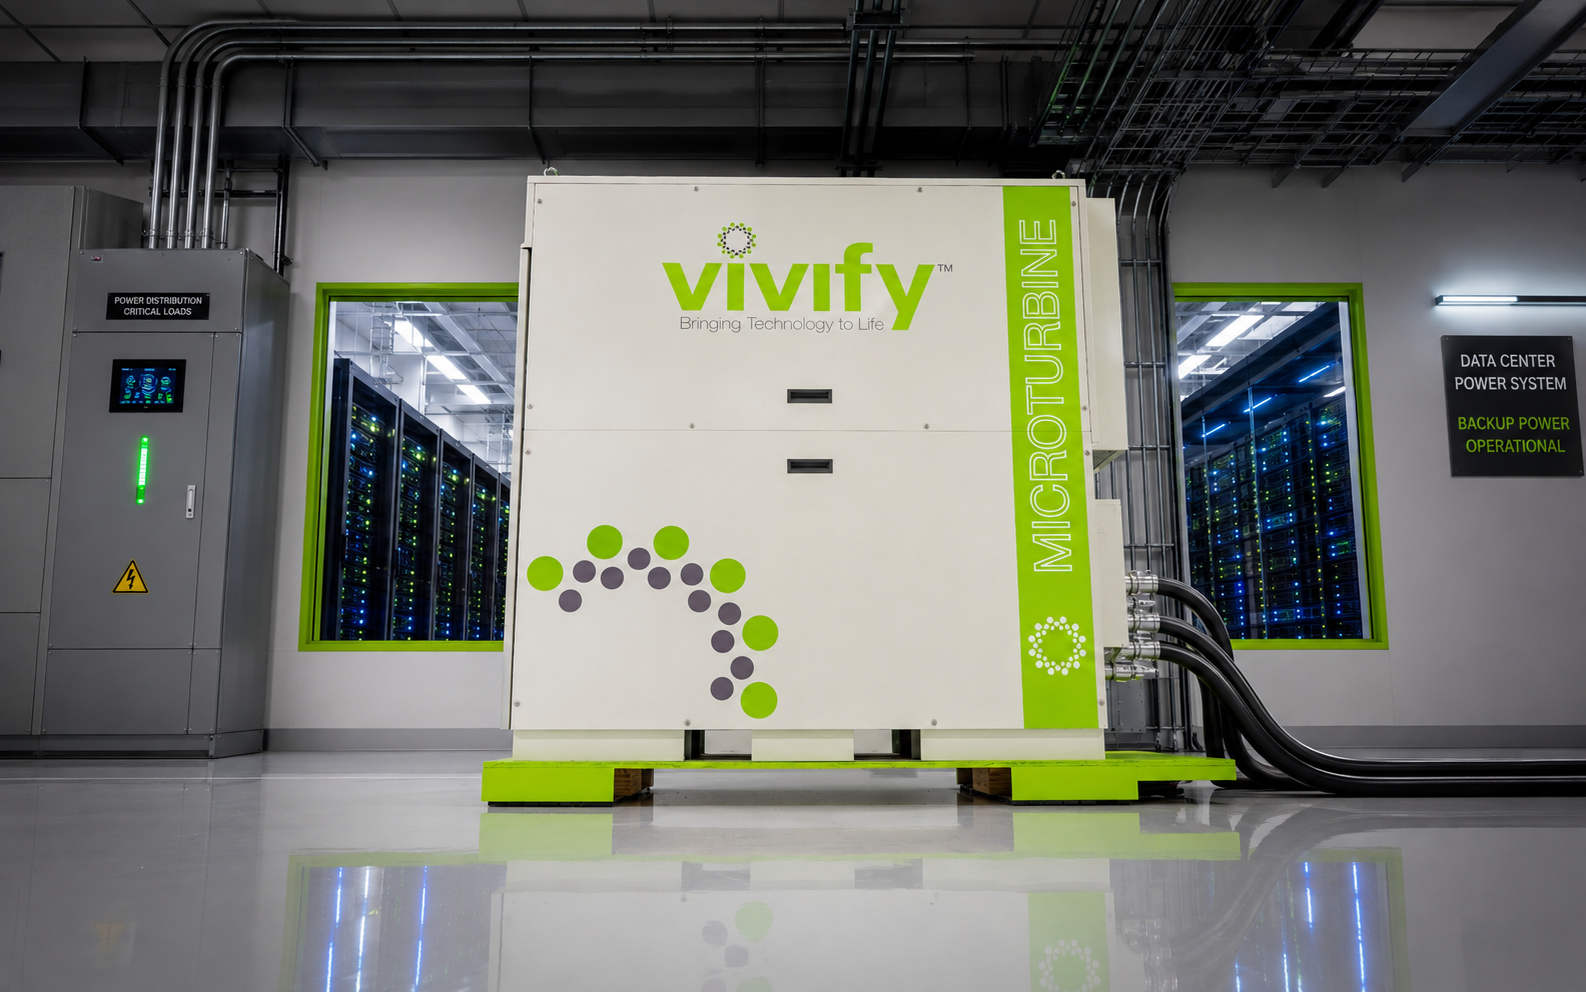
VIVIFY provides behind-the-meter power that moves on the project's timeline, not the utility's. Modular units scale with phased demand, while custom-built installations are engineered around a single site's own load size, site conditions, and long-term demand, rather than dropped in as a standardized off-the-shelf unit. Both run on VIVIFY's hydrogen platform with no interconnection queue, no utility dependency, and no waiting.
99%
pollutant-free output at the point of generation
Site-to-district
scalability, from a single facility to a full campus
Water
is the primary fuel input, produced on-site rather than delivered
Zero
interconnection queue required for behind-the-meter deployment
01 — The Reality
Increased data center power demand isn't a projection anymore. It's the fastest-growing new load on the U.S. grid, and the infrastructure to serve it was not built for this pace of growth.
192 TWh
electricity consumed by U.S. data centers in 2024 — about 4.7% of total U.S. electricity use, and more than double the 1.9% share recorded in 2018.
Source: Lawrence Berkeley National Laboratory, 2025 Data Center Energy Usage Report Update
11.8%
projected share of total U.S. electricity that data centers could consume by 2030, with a modeled range of 9.5% to 15.3% depending on AI hardware deployment scenarios.
Source: Lawrence Berkeley National Laboratory, 2025 Data Center Energy Usage Report Update
33%
share of all growth in U.S. electricity demand between 2024 and 2030 that LBNL projects will come from data centers alone, making them the single largest driver of the nation's electricity growth over that period.
Source: Lawrence Berkeley National Laboratory, 2025 Data Center Energy Usage Report Update
415 → 945 TWh
global data center electricity consumption is projected to more than double from 415 TWh in 2024 to roughly 945 TWh by 2030, driven overwhelmingly by AI workloads.
Source: International Energy Agency, Energy and AI report
~2% per year
projected average annual growth in total U.S. electricity consumption through 2030 — more than twice the rate of the prior decade, with data center expansion as the primary driver.
Source: International Energy Agency, Electricity 2026
15% per year
compound annual growth rate of global data center electricity consumption from 2024 to 2030 — more than four times faster than growth in electricity demand from every other sector combined.
Source: International Energy Agency, Energy and AI report
02 — The Interconnection Bottleneck
Before a new power source can connect to the grid, it has to clear a multi-year study and approval process. For a data center campus racing to meet a build schedule, that queue is often the single biggest risk on the project.
The Department of Energy's own national laboratory tracks this process every year, across every regional grid operator in the country. The trend line has moved in one direction for two decades: longer queues, longer waits, and a lower share of projects that ever make it through. Behind-the-meter, on-site hydrogen power skips this process entirely. There is no queue to enter, because there is no new interconnection to study.
2,290 GW
total capacity actively waiting in U.S. interconnection queues as of the end of 2024 — nearly twice the capacity of the entire existing U.S. power plant fleet.
4.6 years
median time from interconnection request to commercial operation for projects completed in 2018–2024, more than double the under-2-year median for projects built in 2000–2007.
~19%
share of projects that entered U.S. interconnection queues between 2000 and 2019 that have actually reached commercial operation.
700+ GW
capacity that withdrew from U.S. interconnection queues in 2024 alone — outpacing new project submissions for the year.
Source: Lawrence Berkeley National Laboratory, “Queued Up: 2025 Edition, Characteristics of Power Plants Seeking Transmission Interconnection As of the End of 2024”
03 — The Cost of Waiting on the Grid
When new load outpaces new supply, the shortfall shows up as a price. In the country's largest grid market, that price is already landing on ratepayers.
63%
share of the increase in PJM's most recent capacity auction clearing price that its independent market monitor attributed directly to data center load growth — equal to $9.3 billion passed on to ratepayers in a single year.
Source: Monitoring Analytics, PJM Independent Market Monitor, reported via IEEFA
76%
year-over-year increase in first-quarter wholesale power prices across the PJM grid region, which its market monitor tied directly to data-center-driven demand growth.
Source: PJM Independent Market Monitor, reported via E&E News / POLITICO, 2026
50 GW
peak electricity capacity data centers could require across the PJM grid region by 2030 — enough to power more than 20 million households, roughly the combined homes of New Jersey, Pennsylvania, Ohio, Virginia, and Maryland.
Source: Natural Resources Defense Council analysis of PJM capacity market data
$70 per month
projected increase in the average PJM-region household's monthly electric bill by 2028, attributed to data-center-driven capacity costs under current growth forecasts.
Source: Natural Resources Defense Council analysis of PJM capacity market data
04 — AI's Power Curve
AI-specific power demand isn't just adding to the data center load curve; it's steepening it. The International Energy Agency's own 2026 tracking shows AI-driven demand accelerating well ahead of data centers broadly.
17%
growth in global data center electricity demand in 2025 alone — in line with IEA projections for continued acceleration through the rest of the decade.
Source: International Energy Agency, “Key Questions on Energy and AI,” 2026
50%
growth in electricity consumption from AI-focused data centers specifically in 2025 — nearly three times the growth rate of the data center sector overall.
Source: International Energy Agency, “Key Questions on Energy and AI,” 2026
30% per year
projected annual growth rate of electricity consumption from AI-accelerated servers through 2030 — more than three times the 9% annual growth projected for conventional servers.
Source: International Energy Agency, Energy and AI report
45%
the United States' share of global data center electricity consumption in 2024, more than the next two largest markets, China (25%) and Europe (15%), combined.
Source: International Energy Agency, Energy and AI Executive Summary
05 — The Platform
The HOG™ is a self-supporting hydrogen energy system — powered by water as its primary fuel input, producing zero pollutants, and scaling on demand. For phased campuses, Flying Pig™ delivers the same architecture in a containerized, modular unit that scales by adding containers.
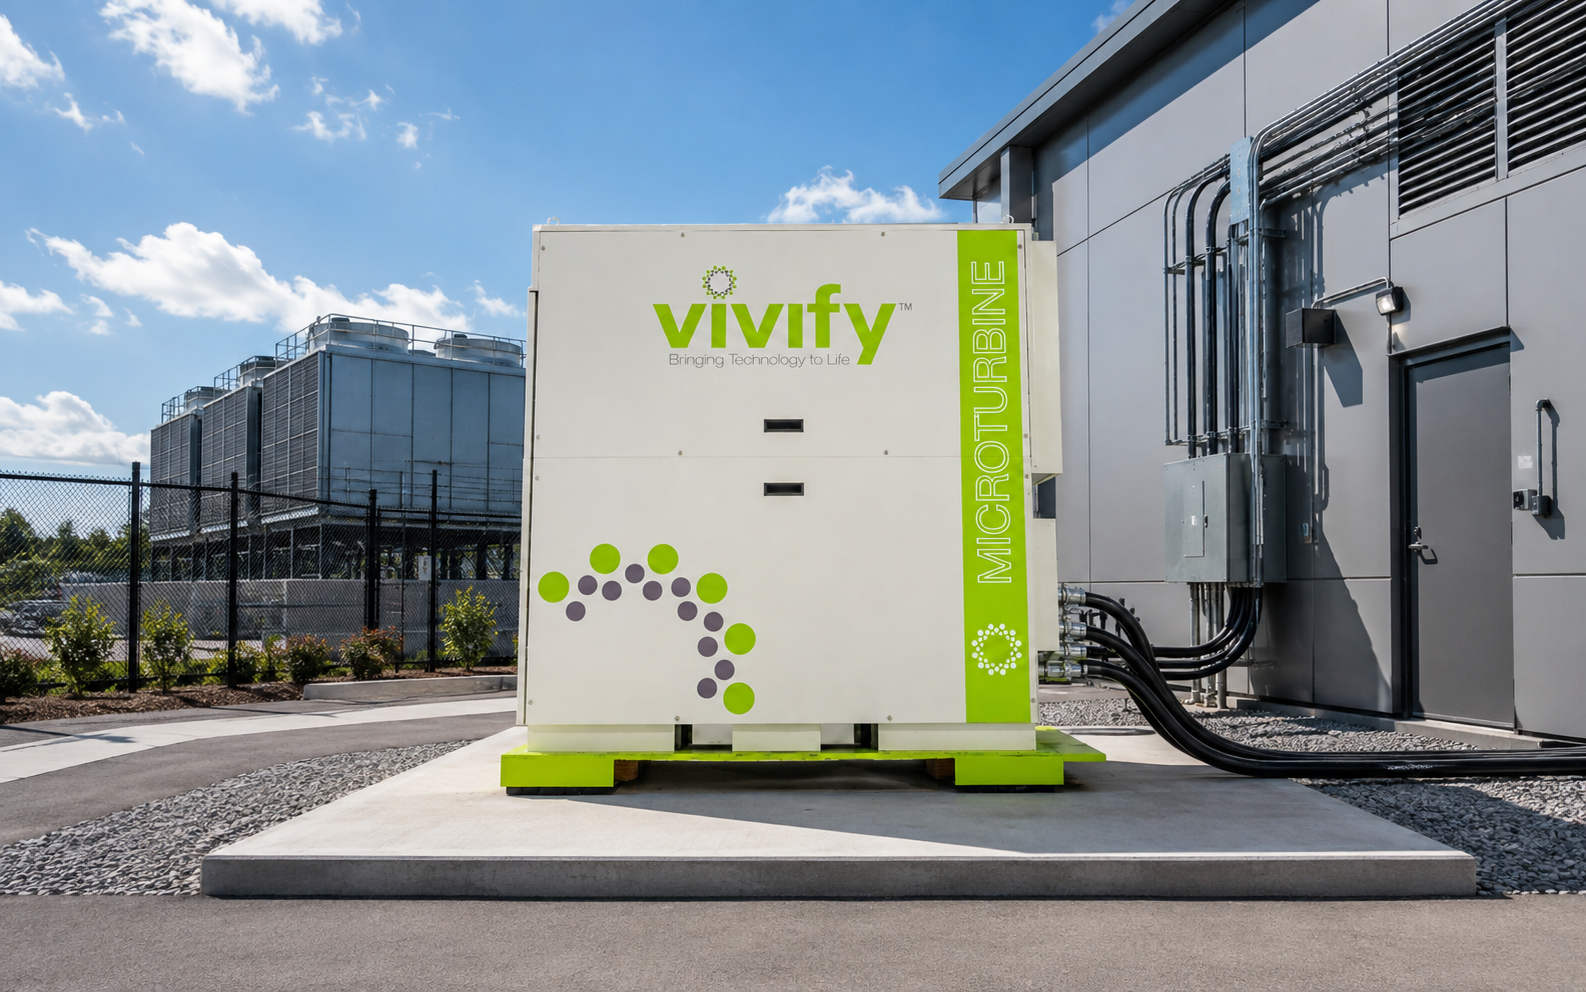
For data centers and AI campuses, the biggest constraint is the years-long queue standing between a project and the grid. HOG™ and Flying Pig™ remove that constraint entirely by generating power on-site, behind the meter, on the project's own construction schedule.
Modular units support phased demand as a campus scales. Site-specific plants are engineered around a customer's long-term load profile. Both are built on the same hydrogen architecture: no interconnection queue, no utility dependency, no waiting.
06 — Where This Fits
From hyperscale campuses to individual high-performance computing facilities, Flying Pig™ and HOG™ deploy wherever grid capacity can't keep pace with load.
Behind-the-meter generation for facilities that cannot wait on interconnection queues.
Dedicated power for HPC facilities with demanding, continuous load profiles.
Site-specific plants or modular deployments engineered to the customer's actual requirements.
Power for locations where local capacity is fully allocated or the utility cannot commit to a build date.
Modular, containerized power that scales in step with construction, rather than ahead of or behind it.
Data Center Power
Talk to VIVIFY about behind-the-meter power for a data center, AI campus, or high-performance computing site.
This page is provided for informational purposes and is not an offer, contract, or commitment. Third-party statistics are drawn from publicly available government, research, and news sources current as of publication and are presented for context; figures are illustrative and specific outcomes will vary. References to third-party organizations do not imply endorsement of, partnership with, or commitment by any such party.
© 2026 VIVIFY Technology. HOG™, CAT™, Flying Pig™, and Pulsar™ are trademarks of VIVIFY Technology.
